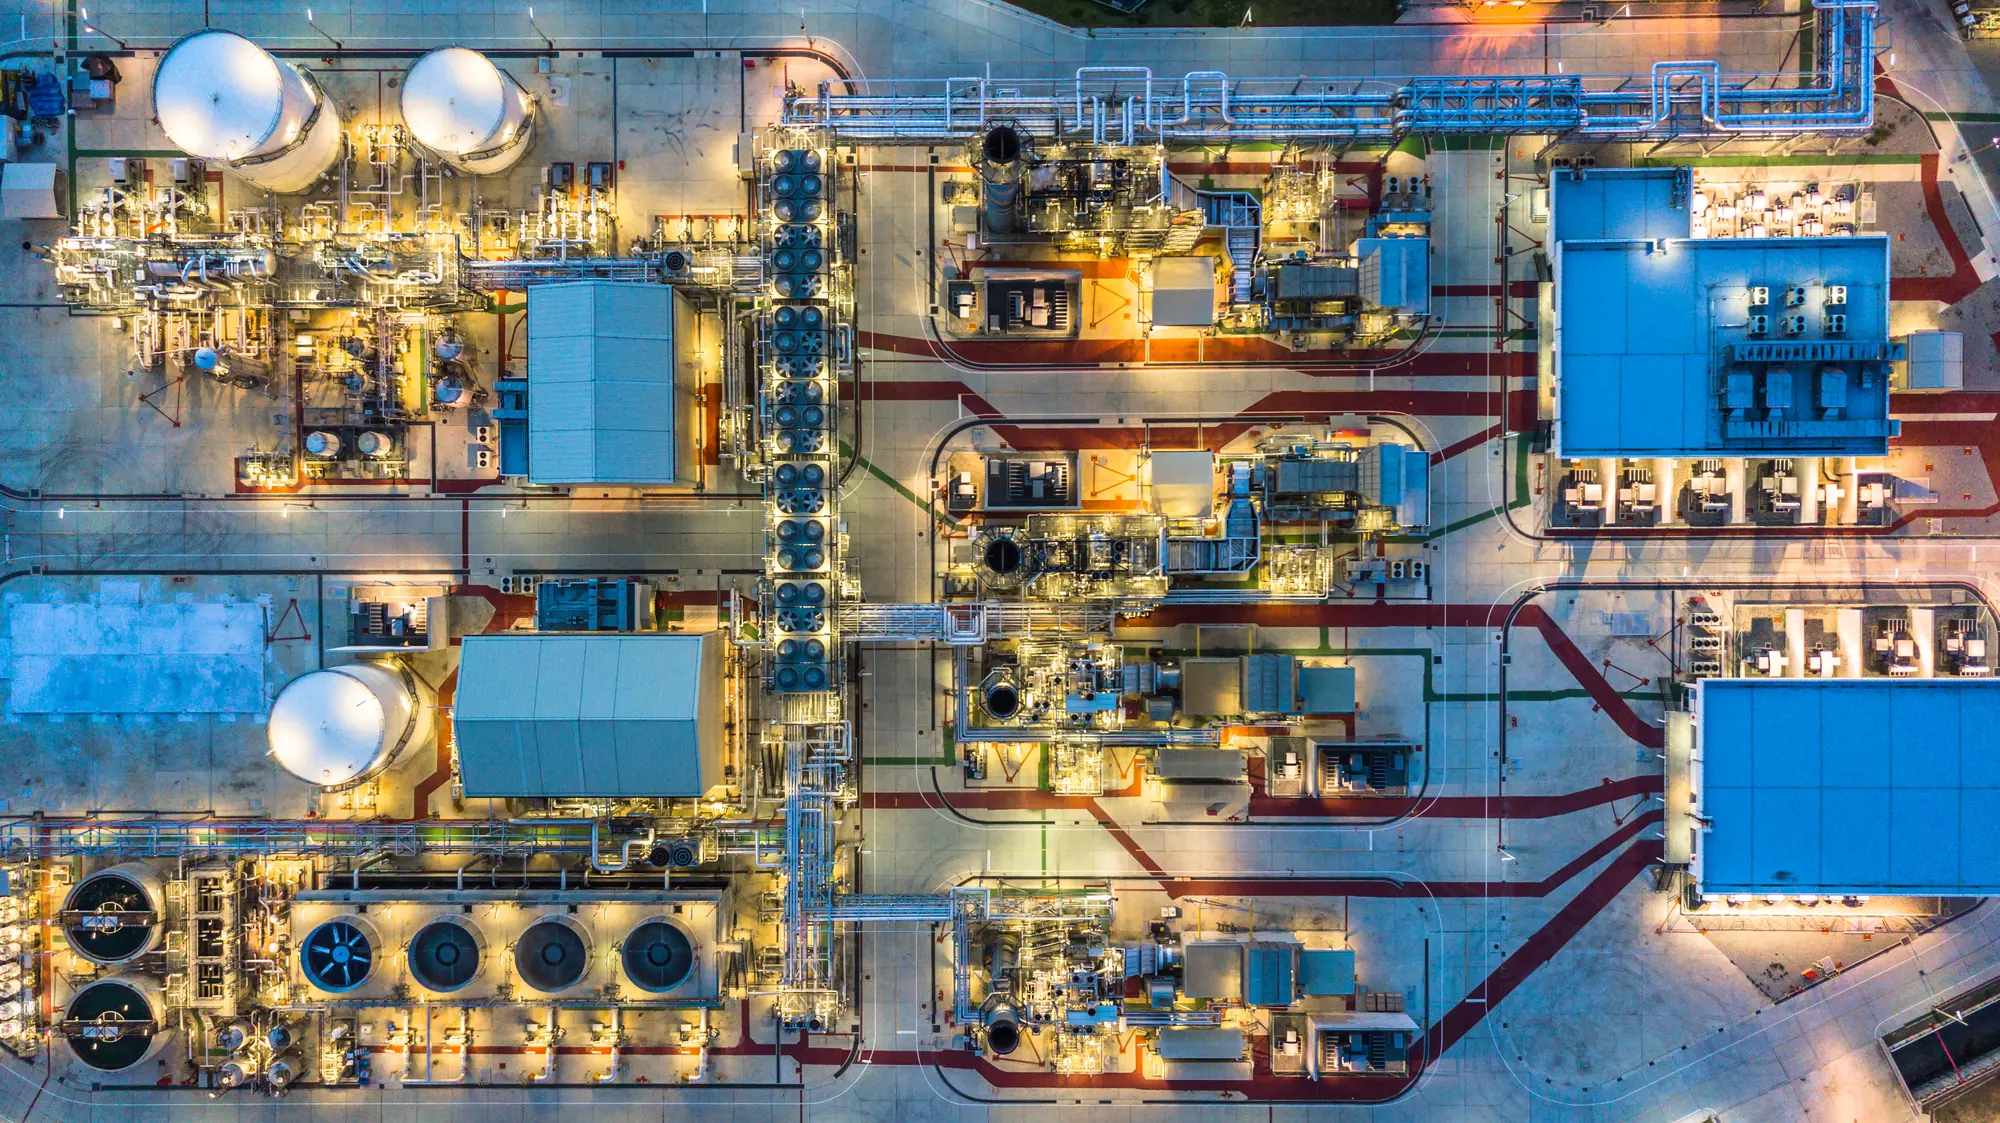
One 2D and 3D view of your plant, where every discipline works from the same data. Click any tag for its condition, its history and its anomalies, then simulate what a scenario would cost before you mobilize anyone.
The problem
On one asset, engineering, inspection, maintenance, HSE and operations each work with their own codes, their own drawings and their own way of naming what they see. The register can be complete and still be read five different ways, and decisions taken on five different readings are rarely the best ones for the asset. Seeing the plant itself, with the data attached to the equipment, gives every discipline the same language.
LENS replaces nothing.
It brings it together.
Capabilities
Built from your P&IDs and your 3D model. Peel it back layer by layer, and read integrity trends straight off the geometry.
The equipment tree, a P&ID or the 3D view. Click a tag and the data comes back filtered for your role.
Annotate in context and share updates live, so the conversation lives on the equipment and not in someone's inbox.
Shorten shutdowns, handle simultaneous operations, and anticipate the support you will need.
Simulation
Select an area of the plant and LENS builds a simulation on it: what has to be isolated and made safe, what accelerated corrosion or a change of process fluid would do, how simultaneous operations across several levels would conflict, and what access, rigging and scaffolding the work would actually need.
You see what a decision costs before you commit a single team to it.
Shared view
Internal teams, partners and contractors work from the real status of the equipment, its anomalies and its interfaces, with rights set by profile, so each team sees what concerns it and nothing else.
No more documents traded by email, no more meetings where the figures do not match, no more work done on stale data. Field feedback and office planning stay in step, in real time.
Getting started
LENS plugs into what you already run: your ERP for work orders, your engineering registers for equipment and documents, your process historians for real-time data, and your own exports and spreadsheets, for the data that still lives in a folder. It reads them through VERSA Core, with no duplication and no migration, and it runs on the quality of that data, which is what a DIAG+ measures first.
Start with a DIAG+ →You provide a tagged model in Navisworks format. If you do not have one, we tag it or rebuild it. Formatting, integration of the 3D into LENS and linking to your P&IDs are done by our team, then the simulations are checked and your teams take it from there.